


When will the NZ ETS surplus reach zero?
Revisiting the implications of forestry forecast approaches for surplus drawdown rates in the NZ ETS.


Summary
A couple weeks back I posted an article looking at the Climate Change Commission’s (the Commission’s) proposals for auction volume and price control settings covering 2024–2029. In the article, I suggested that if these settings were adopted, the surplus could be drawn down to zero ahead of what the Commission have anticipated, and indicated factors that could shift around the date at which the surplus is fully drawn down.
A couple of developments have happened since then. First, staff from the Commission got in touch with what they saw as an issue with the way the original article treated non-surplus post-1989 forest units when using NZ ETS ‘net carbon’ forestry removal forecasts. They suggested instead treating the full pool of non-surplus post-1989 forest units as liquid/usable. This was picked up in Figure 4 of my last article, but we’ll look to re-illustrate this and examine the pitfalls of both this and my earlier approach for understanding traded net emissions demand.
Second, since the posting of the article, I’ve been in touch with MPI staff seeking forecasts of ‘safe carbon’ forestry unit flows in the NZ ETS. Safe carbon forecasts seek to strip out the peaks and troughs of units entering or leaving stock change foresters’ accounts for the units they typically hold for surrenders at harvest. Instead, safe carbon forecasts only show removals from averaging forests, permanent exotic forests, native forests, and low-risk units earned by production forests on stock-change accounting (that are typically traded).
So with these new forestry scenarios now in tow, this article looks to compare the implications for surplus drawdown rates of using:
Net carbon forecasts. [used in the prior article]
Net carbon forecasts with a fully liquid/usable post-1989 forestry stockpile pool. [suggested by Commission staff]
Safe carbon forecasts. [new]
Target accounting forecasts. [suggested by Commission staff, and used in part by the Commission to set auction volumes]
A technical topic to be sure, but I’ll do my best to simplify for those brave enough to read the body of this article. A spreadsheet containing both safe carbon and net carbon forecasts used in this article can be found on the MfE website (MPI, 2023): Link. Target accounting forecasts can also be found on the MfE website, published as part of the Government’s most recent updated emissions projections to 2050 (MfE, 2023b): Link.
I contend that out of the four forecast approaches, safe carbon unit flows are the most appropriate plug-and-play dataset for understanding traded net emissions demand/supply from forestry in the NZ ETS and implications for surplus drawdown rates from a given set of auction volume settings.
When using the Commission’s ‘current policy reference’ scenario for gross emissions and central estimate of the current surplus, safe carbon forecasts see the surplus fully drawn down in the 2026–2027 surrender year. This compares to 2025–2026 using a net carbon forecast approach, 2029–2030 when using the net carbon forecast and treating the whole post-1989 forest unit pool as liquid/usable, and the 2027–2028 surrender year for target accounting. A dataset of the results for each forestry forecast (including a range of additional scenarios) can be found here: Link.
Again, these safe carbon forecast scenarios suggest that there might be more bite in drawdown rates of the surplus over the 2020s than what has been illustrated in prior public material that I’m aware of.
Fuller datasets that show areas of forest registered in the NZ ETS broken down by forest species, establishment date, registration date, look-up tables versus field measurement approach (FMA), region, and forestry accounting rule-set the forest is registered under would provide the ability to do a more cohesive analysis. These datasets would also allow exploration of the sensitivity of assumptions such as the proportion of existing forests that are permanent forests managed for carbon returns, and production foresters’ trading behaviour.
However, currently these data are not made publicly available by the Government or Commission. On the non-public treatment of these datasets (Commission, 2024), I am not sure whether this is due to privacy issues, aspects of the Climate Change Response Act, or other reasons. I’d encourage the Government and Commission to look to address this, given the importance of market actors’ access to this data to ensuring a “strong and stable” NZ ETS (Watts, 2024).
More generally these differences in surplus drawdown timing dependent on the forestry forecasts used suggest there is a need for analysis on auction volume settings to more closely examine net emissions demand in the NZ ETS as part of the auction volume setting process. In particular, examining the impact of differences in net forestry removals year-on-year between New Zealand’s targets and the NZ ETS.
Finally, assuming that updated forestry forecasts are developed as part of the Government’s next fiscal baseline update, I’ll look to share the impact of these updated figures on my LinkedIn page. This next set of official forecasts should incorporate new data on the proportion of forests registered from 2018–2022 that have switched to averaging. This data wouldn’t have been available for the safe carbon and net carbon forecasts used in this article.
Other than that, I look forward to reacting to the Government’s consultation responding to the Commission’s advice alongside you all within the next couple of months. Here’s hoping we get some cohesive signs of the direction of travel for the Government’s aims for the NZ ETS.
How are the various forestry forecasts different?
Forestry carbon accounting approaches seek to estimate the level of carbon sequestered by a forest based on a set of variables known about the forest (e.g, tree species, establishment date, area, and stocking rate).
In the NZ ETS and New Zealand’s targets, two primary accounting approaches have been applied to date, averaging and stock change accounting. Averaging accounting seeks to represent the average level of carbon sequestered by a forest over multiple harvest cycles by crediting a forest on its first rotation up to the age at which it reaches this average carbon stock level. Whereas as a broad simplification, stock change accounting crudely approximates with ‘what the atmosphere sees’, by crediting units while carbon stock increases through growth in the forest, and debiting these forests when they harvest or deforest leading to reductions in carbon stock.
Forests in the NZ ETS include a mix of forests registered under stock change accounting (available to participants from 2008–2022 as a general category, and from 2023 onwards as part of the permanent forest category), and averaging (available to forests registered from 2018–2022 in a time-limited window last year, and available to all forests from 2023).
In contrast, New Zealand’s accounting for forests when counted towards its targets and emissions budgets (termed ‘target accounting’ in this article) applies averaging accounting across New Zealand’s entire forestry estate, including for forests registered under stock change accounting in the NZ ETS.
In addition, target accounting features differences in variables used to calculate carbon stocks than for averaging in the NZ ETS. For example, New Zealand’s pool of harvested wood products is accounted for in New Zealand’s targets, but not in the NZ ETS. As a result, the age at which a forest reaches its average carbon stock is 23 years in New Zealand’s targets, in contrast with an age of 16 years for pine forests in the NZ ETS. This is roughly equivalent to a 59% increase in total credited carbon stock (300 tonnes per hectare) for pine forests registered under the Field Measurement Approach (FMA).
So for forests registered in the NZ ETS, the removals credited towards New Zealand’s targets will not resemble traded unit flows in the NZ ETS as a result of these differences in accounting.
Turning now to the forecasts used by the Government to estimate future NZ ETS unit flows, net carbon forecasts are used as part of the Government’s fiscal accounts, and estimate the net level of units credited or debited from forestry participant’s accounts each year. This forecast is calculated based on a range of data related to forest species, establishment date, registration date, and other variables related to these forests.
A second approach to forecasting NZ ETS unit flows are safe carbon forecasts. This approach seeks to strip out carbon unit flows from stock change forests where they possess an equivalent liability at surrender. This is because foresters will typically not trade these units, holding them in their account until they are used to meet surrender obligations at harvest. Instead, safe carbon forecasts only reflect crediting of carbon to forests under averaging, native forests, permanent forests, and units earned by production forests registered under stock change accounting that do not have a corresponding surrender liability at harvest.
Figure 1 below illustrates the differences in year-on-year net emissions/removals between target accounting, net carbon, and safe carbon forecasts for forests registered in the NZ ETS. This figure highlights that due to differences in how carbon is calculated in target accounting, target accounting systematically overstates carbon flows in the NZ ETS. This figure also shows that net carbon forecasts can fluctuate as either a net-emitter or net-remover dependent on the proportion of forests registered under stock change accounting that are harvested that year. Over very long time horizons, net carbon and safe carbon forecasts should broadly equate to one another, though can vary substantially in any given year. For the period 2023–2030, safe carbon forecasts see a net removal of 54.7 million tonnes, and 50.7 million tonnes for net carbon forecasts.

What is best for understanding traded NZ ETS demand/supply?
The primary approach taken in my earlier article on the implications of the Commission’s advised settings for surplus drawdown rates used net carbon forecasts to illustrate net demand/supply from forestry as part of net emissions demand. In most figures, this article treated non-surplus post-1989 forest units in private accounts as a separate static variable.
In reality however, a portion of these 51–65 million non-surplus post-1989 forest units held in private accounts (Commission, 2024) are likely to be used by stock change foresters to meet their surrender obligations at harvest over the next few years. Figure 4 in my earlier article sought to reflect this uncertainty by assuming an additional 59.7 million units currently in private accounts were traded or used for surrender obligations between 2024–2029.
After posting the article, Commission staff got in touch and suggested a cleaner approach could be to add non-surplus post-1989 forest units to the starting estimate of the surplus volume. However, this approach (as well as the scenario illustrated in my previous article in figure 4) comes with its own pitfalls for the time horizon under examination, as it is highly unlikely that the entire pool of post-1989 forest units in private accounts will be tagged for harvests planned within the next 6 years, or be otherwise willingly traded. Nevertheless, illustrating both of these net carbon forecast scenarios gives a sense of the sensitivity of assumptions related to treatment of non-surplus post-1989 forest units held in private accounts when using net carbon forestry forecasts.
Helpfully, a somewhat cleaner approach is possible thanks to MPI’s (2023) release of forecasts of safe carbon flows. This forecast approach intersects nicely with the Commission’s approach to surplus calculation, as units set aside for harvest liabilities for production forests under stock change accounting are stripped out of both the Commission’s calculation of surplus volumes and MPI’s forward projections of unit demand/supply.
As for target accounting forecasts, the inherent differences in accounted carbon flows mean these offer an inaccurate sense of forestry’s net emissions in the NZ ETS. So I wouldn’t recommend this approach to those involved in market forecasting, except as a rough sense of long-term trends in net emissions demand/supply.
Figure 2 below seeks to illustrate surplus drawdown rates when utilising each of the four forestry forecast scenarios. This figure utilises the Commission’s (2023) ‘current policy reference’ scenario for gross emissions and their (2024) central projection of surplus volumes, together with MPI’s (2023) central estimates of future afforestation.

All four forecast scenarios see the surplus drawn down by the end of the decade. For safe-carbon forecasts (preferred by the author), the surplus is fully drawn down by the 2026–2027 surrender year. This compares to 2027–2028 for target accounting, 2025–2026 for net carbon forecasts, and 2029–2030 for net carbon forecasts when treating post-1989 forest units as liquid/usable within this time horizon.
The year-on-year gap between net emissions demand and unit supply available below the cost contaiment reserve (CCR) when using safe carbon forecasts (preferred by the author) are also shown in Figure 3 below. Over 2024–2029, there is a 17.5 million unit gap per-annum between net emissions demand and supply.

Figure 4 below adds to this picture by attempting to illustrate the range in surplus drawdown outcomes when varying assumptions for future afforestation rates, gross emissions, and starting surplus volumes. This figure shows the range in net surplus each year per forestry forecast across each of the Commission’s three estimates of current surplus volumes, both the Commission’s ‘demonstration pathway’ and ‘current policy reference’ scenarios for gross emissions, and each of MPI’s low, central and high future afforestation projections. Full results from these scenarios (as well as scenarios exploring the impact of triggering the CCRs) are available here: Link.

As a limitation of use of these datasets, it is worth noting that assumptions and underlying datasets used by the Commission and MPI differ somewhat. For example, the date at which sampling of ETS registered forests is taken differs between the Commission’s most recent report and these older MPI forecasts. Second, assumptions related to the frequency of permanent exotic forests among existing forests differ slightly, as do their approaches to calculation of ‘low-risk’ units earned by stock change forests. Nevertheless, for the purposes of this article seeking to gauge surplus drawdown rates, they’re as good as it gets for plug-and-play use of publicly available datasets at present.
Why does the choice of forestry forecast matter?
It should be fairly obvious for those who’ve read through the sections above that use of different forestry forecasts can lead to substantively different conclusions on drawdown rates for surplus volumes. While many market actors reading this article will have reasonably sophisticated means for understanding variables affecting gross emissions (such as the future of the Tiwai Point aluminium smelter), the need to also understand forestry unit flows is, I hope, clear to those reading.
Relating this back to the Commission’s approach to its recommendations for auction volumes used for their past three reports, this variance between forestry forecasts highlights a potential gap within their current methodology. To understand how this arises, I’ll briefly turn to the two ways that forestry forecasts are incorporated in the Commission’s approach to setting auction volumes.
First, forestry is incorporated through the Commission’s calculation of surplus volumes, where they seek to distinguish between ‘surplus’ units held by foresters that are likely to be traded, from those that are held for future harvest liabilities by production foresters operating on stock change accounting. While it is likely their methodology will improve over time as better information becomes available; given what we know today, this part of the Commission’s approach is broadly sound.
Second, the Commission calculates NZ ETS unit limits based on New Zealand’s emissions budgets, which implicitly utilise target accounting. Because of the differences between target accounting and actual unit flows in the NZ ETS (explored above), this means that the NZ ETS will, all else equal, need to generate a larger area of forest to ensure its cap is met, or see surplus drawdown rates above those sought in the Commission’s calculations.
As afforestation acts as a lagged response variable within the time horizon of the Commission’s recommendations (due to the multi-year lead time needed to scale-up new afforestation), my inclination is that differences in surplus drawdown rates from the Commission’s target rate are quite plausible in light of this. This suggests a need for future work setting surplus drawdown rate targets and NZ ETS auction volumes to explore the response of NZ ETS demand, focusing particularly on differences in implied forestry removals between New Zealand’s targets/budgets and the NZ ETS.
Is there risk of junk in, junk out with our assumptions?
Three assumptions play a key role in determining the conclusions drawn from any analysis of the NZ ETS market for the ~5 year time horizon under examination. These are:
Foresters’ determination of ‘low-risk’ units under stock change accounting (particularly for owners of large multi-site forest estates).
Rates of permanent exotic forests among existing stock change forests.
Trading behaviour for non-surplus post-1989 forest units.
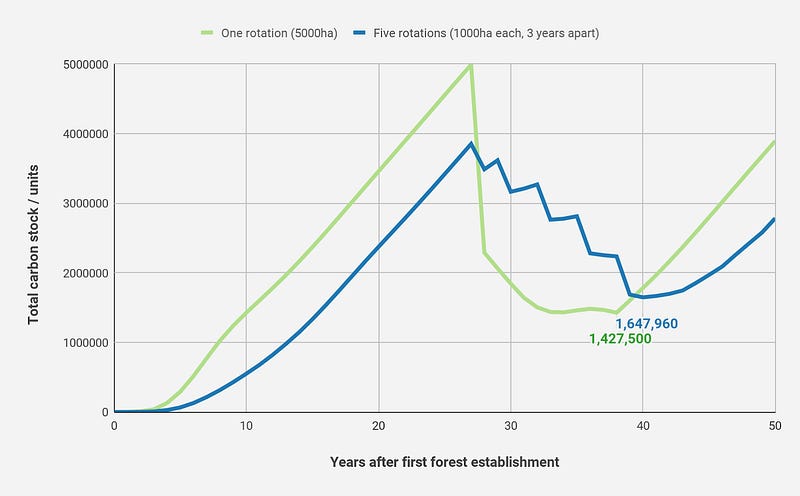
The first of these assumptions owes to a long-known feature of unit flows under stock change accounting for operators of large multi-rotation forest estates. By establishing a given area of forest over multiple years rather than in one year, forest operators are able to lift up the minimum level of low-risk carbon seen in the forest after harvest. This can be seen for example by examining a hypothetical 5,000ha area of forest, where one forest operator establishes the entire area in one year, and the other operator establishes it gradually in 1,000ha increments, shown in Figure 5 below. As seen in Figure 5, gradual establishment of the forest increases the minimum carbon stock in the forest after the first round of harvesting (aka, the level of low-risk carbon able to be traded) by 15.4% from 1.43 million units to 1.65 million units. Careful planning of the timing of harvest and submitted emissions returns can increase this gap further.
Second, rates of permanent exotic forests among existing NZ ETS registered forests remains a poorly understood variable. MPI’s central estimates assume that 10.5% of existing forests are operated as permanent forests grown solely for carbon, drawn from research by Manley (2018). While the Commission (2024) has explored the sensitivity of this assumption through their calculation of surplus volumes, the impacts of this assumption remain difficult to analyse with credible accuracy as a member of the public due to the lack of provision of data on areas of forest broken down by both establishment and registration dates. Increased surveying of these forests (for example, by requiring NZ ETS forest owners to declare their planned harvest date when they submit emissions returns) would go some way to addressing the Government and Commission’s lack of visibility of the prevalence of this behaviour. The Government’s current use of semi-regular surveys of forest owners’ intentions offers a somewhat weaker approach due to the ability of forest operators to refuse to respond to such surveys, a behaviour we’ve seen play out recently (Manley, 2023, p. 6).
Finally, assumptions related to the liquidity of non-surplus post-1989 forest units are a key determinant of surplus drawdown and price dynamics. This article has explored scenarios covering both the extremes of possible assumptions, with these units either untraded (resulting in the surplus drawing down in the middle of the decade), or fully utilised and traded (resulting in the surplus being drawn down towards the end of the decade). The Ministry for the Environment’s (2023a) modelling conducted for the 2023 ETS review also sought to explore scenarios in which these non-surplus units could be traded, but paid back in later years. However, to my knowledge, this modelling placed no limitations on the proportion of non-surplus units that could be willingly traded.
However, neither of these assumptions are entirely convincing, as it is likely that due to inherent variability in the risk profiles adopted by foresters, some portion of these units are likely able to be bought at a reasonable premium, but others may remain highly inelastic. So while I’m at risk of sounding like a broken record, again, further advancements on these existing analyses would benefit from enhanced availability of data (e.g, allowing for an assumed varied willingness to sell units between large forest owners and small forest owners, or varied willingness to sell based on the length of time till next harvest).
A final aside on recent NZ ETS news
It has been a busy couple of news weeks for the NZ ETS. First, Climate Change Minister Simon Watts revealed the Government is progressing the National Party’s proposals for restrictions on afforestation by Land Use Capability (LUC) classification (Gibson, 2024). While I’ll save my fuller thoughts for a future piece; the potential impacts on afforestation rates and the regions afforestation occurs in shouldn’t be underestimated, if what comes on the table resembles the National Party’s manifesto. Indeed, those familiar with the imperfections and complexities of translating national LUC classification maps to a property-scale will likely have some sense of the potential headaches caused by such an approach.
Second, the March NZ ETS auction on 20 March cleared 80% of the general pool of units available (2.97 million units). As I’m not well read on the new confidential reserve mechanism regulations, nor the contractual arrangements in place between participants in the auction and emitters with surrenders due soon, I will leave finer analysis on this clearing of the auction to others.
However, the 18% drop of spot-markets following the auction would suggest some eagerness on the part of a portion of surplus unit holders to get out of their positions, and/or foresters eager to see returns on their recent glut of units earned at the end of the 2018–2022 Mandatory Emissions Return Period. While the Commission’s broader approach to reducing the surplus has focused on use of under-supply to eke out these surplus units over time, middling returns faced by non-participant speculators also carries the potential to clear out more opportunistic short-term players. A potential small gain for the health of the market, even if the noise may suggest a less healthy diagnosis on first glance.
References
Climate Change Commission (2023) 2023 Advice on the direction of policy for the Government’s second emissions reduction plan. Wellington, New Zealand: Climate Change Commission, p. 193. Available at: https://www.climatecommission.govt.nz/our-work/advice-to-government-topic/advice-for-preparation-of-emissions-reduction-plans/2023-advice-to-inform-the-strategic-direction-of-the-governments-second-emissions-reduction-plan-april-2023/.
Climate Change Commission (2024) Advice on NZ ETS unit limits and price control settings for 2025–2029. Wellington, New Zealand: Climate Change Commission, p. 74. Available at: https://www.climatecommission.govt.nz/our-work/advice-to-government-topic/nz-ets/our-advice-on-the-nz-ets/nzets-advice-2025-29/ (Accessed: 14 March 2024).
Gibson, E. (2024) ‘Government earns $190m from first carbon auction of the year’, Radio New Zealand, 20 March. Available at: https://www.rnz.co.nz/news/national/512247/government-earns-190m-from-first-carbon-auction-of-the-year (Accessed: 22 March 2024).
Green, K. (2024) ‘Is the Climate Change Commission setting the NZ ETS up for a bumpy ride in the 2020s?’, 18 March. Available at: https://medium.com/@nzkristengreen/is-the-climate-change-commission-setting-the-nz-ets-up-for-a-bumpy-ride-in-the-2020s-92488a0ffc8b (Accessed: 18 March 2024).
Manley, B. (2018) Intentions of forest owners following harvest of post-1989 forests. MPI Technical Paper 2018/55. Wellington, New Zealand: New Zealand Government, p. 23. Available at: https://www.mpi.govt.nz/dmsdocument/30687-intentions-of-forest-owners-following-harvest-of-post-1989-forests (Accessed: 31 March 2024).
Manley, B. (2023) Afforestation and Deforestation Intentions Survey 2022. MPI Technical Paper 2023/09. Wellington, New Zealand: New Zealand Government, p. 26. Available at: https://www.mpi.govt.nz/dmsdocument/57130-Afforestation-and-Deforestation-Intentions-Survey-2022 (Accessed: 1 April 2024).
Ministry for Primary Industries (MPI) (2023) ‘NZ ETS forestry unit flows and allocation’. Available at: https://environment.govt.nz/assets/publications/climate-change/NZ-ETS-forestry-unit-flows-and-allocation.xlsx (Accessed: 28 March 2024).
Ministry for the Environment (MfE) (2023a) Review of the New Zealand Emissions Trading Scheme: Summary of modelling. ME 1785. Wellington, New Zealand: New Zealand Government, p. 46. Available at: https://environment.govt.nz/publications/review-of-the-new-zealand-emissions-trading-scheme-summary-of-modelling/ (Accessed: 18 March 2024).
Ministry for the Environment (MfE) (2023b) ‘Updated emissions projections to 2050 released’. Available at: https://environment.govt.nz/assets/what-government-is-doing/climate-change/2050-historical-and-projected-sectoral-emissions-data-November_2023-for-publishing-v01.xlsx (Accessed: 29 March 2024).
Watts, S. (2024) ‘First NZ ETS auction for 2024 partially clears’. New Zealand Government. Available at: https://www.beehive.govt.nz/release/first-nz-ets-auction-2024-partially-clears (Accessed: 22 March 2024).